
Demand Gen Waterfall / Marketing Reverse Waterfall
A demand gen waterfall, also referred to as a marketing reverse waterfall, is a useful tool that can be applied to a variety of purposes. First, it will help you come up with realistic budget numbers and set an expectation of the effectiveness of digital advertising across many channels. The second is that it can show you trends, allowing you to identify the most effective channels easily, and when you have reached capacity in a specific channel.
I have created two calculators, one being general, and the other enabling month-by-month trend analysis by channel. The second calculator requires more work but is much more useful when attempting to explain how, why, what, and when of a digital marketing program.
The first sheet:
Reverse Waterfall (click to be taken to the Google Spreadsheet)
The great thing about these sheets is that you don’t need to put in that much information. The calculators will work their magic and give you the data you need to understand better your marketing spend a little bit better. I’ll go over how to get the information, but because so many different systems are used and there are so many ways to approach the problems, the way I do it might not be the way that you can get it done. My process is just a suggestion.
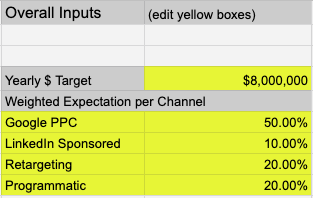
Common Data Inputs
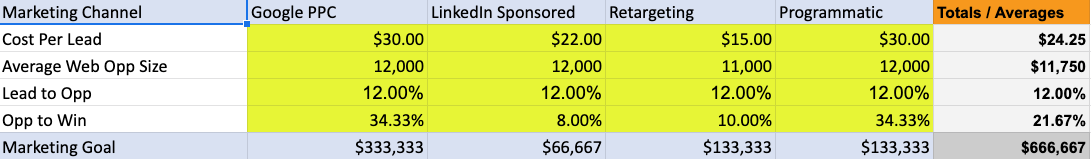
Cost per lead: This is how much it costs you to acquire a lead from a source. In the short sheet, the cost per lead is the average cost per lead of all channels. In the trending sheet, this is by channel cost of lead acquisition. You can get this data from your ad providers as long as you track attribution of lead generation. If you use a form from Marketo, Hubspot, or any other software like those, you can have the leads automatically generate in your CRM. This auto-import is a vital part of any attribution model.
Average Web Opportunity Size:
This is the average size, in dollars, of each opportunity that gets generated from the web. You’ll need the same lead attribution that you have for the cost per lead metric.
Lead to Opportunity Conversion Rate:
From within your CRM, you will need to build a report that shows you how often you turn a lead into a real opportunity. In the short sheet, this is just an average, in the trending sheet, this is calculated per month. Depending on your lead flow definition and how you handle opportunities, this number can vary widely. Be prepared to answer questions of how you define a lead and an opportunity.
Additional inputs for the demand gen waterfall trend analysis
Web Generated Opportunity to Revenue Rate:
The web to win metric is almost the same as above, but looks at how often your web-generated opportunities turn into real revenue. In the output, you’ll find a lead to revenue number that is generated for you. I like to use all three numbers as they tell a better story than just the lead to revenue figure. Marketing, or more specifically, advertising is the act of generating leads. Different processes that may not be under the marketing department’s prevue will affect the revenue generated from the web and is not a useful metric to use in isolation.
Marketing Goal:
The marketing goal, in dollars, is how much revenue you need to generate over some time. In the short sheet, this is looking at twelve months. In the trending sheet, this is entered as the full year, and then the calculator will break it down into months.
On the trend analysis spreadsheet, on the main dashboard, you will have to enter in a few additional pieces of information. You’ll need to enter in the weight distribution for each addressable channel. Otherwise, everything is contained within each month.
Standard Sheet Data Outputs
Web to Win Rate:
Calculates the rate at which you close deals that are generated from the website. These are used as the primary factor for each calculation beyond this point.
Number of Customers per 1000 Leads:
The number of customers you obtain per 1000 leads generated.
Revenue per 1000 Customers:
The revenue that you can expect for every 1000 customers generated from the website.
Leads to Marketing Goal:
The number of leads you need to generate to reach your previously set marketing goal.
Converted Leads to Goal:
The number of converted leads (web to win) that you can expect to generate from the above-listed information.
Leads to Goal $:
Revenue that you will generate from the lead information previously calculated. On the short sheet, this number should match your goal. On the trend sheet, this number will be split between months.
Cost for Leads:
The amount of money you will have to spend to get the number of leads needed to fulfill your quota. CPL is essential for setting the budget. The data outputs from the earlier portions of the sheet will give you enough useful ammo to use in any budgetary discussions.
Monthly Budget:
The amount of money that you will have to spend every month to meet your quota.
The Usefulness of Demand Generation Waterfalls
I often find myself answering the same questions about digital marketing spend over and over again, and I don’t know if I have ever been able to ask for budget intelligently without these sheets. The purpose of the sheet is to prove out digital lead generation costs based on fact. Potential exists to gain efficiencies in your marketing spend, and that can also be tracked with the use of these sheets.
If you don’t have attribution capabilities in your website and CRM, you might have some difficulties using these sheets. They rely heavily on an ability to understand how much you are spending to generate leads, how those leads convert, and how much those leads end up being worth to your company. If you don’t have the ability to do this, my suggestion is that you focus on obtaining the ability to do so.